


Orotracheal extubation is a standard procedure in the intensive care unit (ICU). It can be associated with various complications in the critically ill population, notably bronchospasm, severe cough, hypertension, tachycardia, tachypnoea, poor respiratory mechanics, and major complications such as upper airway obstruction and stridor, desaturation, etc. [1]. The incidence of complications following extubation has been reported between 6 to 100% in the same population [2–4]. Multiple risk factors, for instance, hemodynamic lability, increased secretions, weakness, malnutrition, etc., play a significant role in complicating routine extubation. The incidence of aspiration pneumonitis in the ICU setting ranges from 5 to 15%, while that of aspiration pneumonia ranges from 20 to 30% [5]. The primary reason for aspiration pneumonia is the micro-aspiration of secretions during traditional extubation and mechanical ventilation, while the main cause of aspiration pneumonitis is usually post-extubation dysphagia.
The clinical equipoise for the determination of safe and better methods of extubation exists in the literature. The traditional method with endotracheal suctioning and the positive-pressure method alone without suctioning [6] are two commonly used methods in clinical practice. Earlier studies have reported better physiological outcomes with positive pressure alone during extubation, based on the theory that the airflow passing between the endo-tracheal tube and the larynx pushes the collected secretions out from below the glottis to the oral cavity, which are then suctioned. On the other hand, the traditional method supposedly creates a negative pressure that favours the aspiration of oral secretions into the respiratory tract. Given the clinical uncertainty and lack of robust literature, we evaluated the effectiveness and safety of positive pressure extubation, compared with traditional extubation without positive pressure in patients with critical illness admitted to the ICUs.
The novelty of this study lies in the fact that no previous study has compared the two types of extubation techniques in evaluating endpoints using lung ultrasound (lung USG) findings in intensive care.
METHODS
Trial design
This was a double-blinded, investigator-initiated, prospective randomised controlled study with two groups undertaken in a single-centre tertiary care ICU in north India conducted from January 2020 to July 2021.
Study settings
After obtaining approval from the institute’s ethi-cal committee (Ref No. IECPG-627/28/28.11.2019, RT-15/19.12.2019) and written informed consent from the patient’s next of kin or legally acceptable representative, the patients admitted to the ICUs were enrolled in the study. The trial was prospectively registered in the clinical trial registry of India (CTRI/2020/02/023166).
Participants
The eligible patients were older than 15 years, mechanically ventilated with an endotracheal tube for at least 72 hours and were deemed fit for extubation at the physician’s discretion after a successful T-piece/pressure support ventilation trial for 30 minutes [7]. Excluded patients were those who were planned in advance to be extubated directly to non-invasive ventilation (NIV) or high flow nasal cannula (HFNC), with severe asthma, bullous lung disease or severe emphysematous lung disease, with suspected raised intracranial pressure or with a Glasgow Coma Scale score < 8.
Allocation, randomisation and blinding
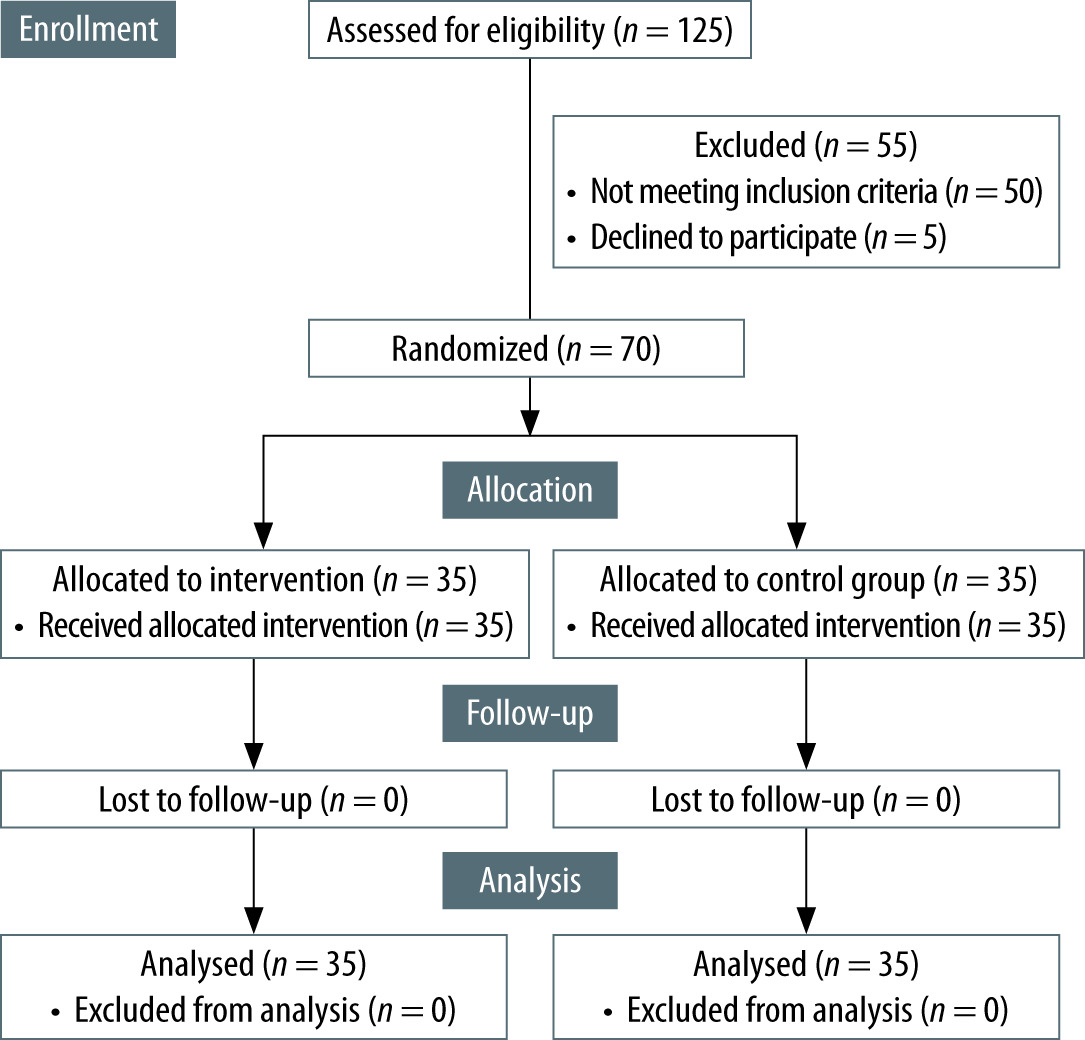
A total of 125 patients were assessed for eligibility to be included in the trial. Out of them, 50 patients were excluded as they did not fit the inclusion criteria. Five patients declined consent.
Seventy patients were randomly allocated to the two groups with an enrolment ratio of 1 : 1, using computer-generated random numbers. Block randomisation was done using variable-size blocks, and the allocation thus obtained was concealed by sequentially numbered opaque sealed envelopes. The primary assessor enrolled the patients while the physician in charge assigned the intervention according to the entry in the sealed envelope. The sealed envelope was opened just before the end of the spontaneous breathing trial (SBT) by the physician, who proceeded with the planned extubation according to the study protocol.
All patients who were randomised received the assigned intervention (Figure 1).
Trial interventions
When patients were found fit for extubation, a baseline chest X-ray and lung ultrasound were performed, and lung ultrasound scores were noted by the assessor, who was blinded to the group to which the patient was allocated. In the intervention group, also called the positive pressure extubation group (PPE), after the SBT, the patients were connected back to the ventilator with a pressure support set to 15 cm H2O and a PEEP set to 10 cm H2O. There was no specific reason for this set pressure level apart from the fact that this was a significant amount of positive pressure given to the patient at the end of the SBT, as is usually given in operation rooms during extubation. After 5 minutes, the cuff was deflated, and the physician in charge extubated the patients without endotracheal suctioning. Immediately after the extubation attempt, a suction catheter was introduced into the oral cavity to remove secretions. In the control group, also called the traditional extubation group (TE), after a successful SBT, the patients were not reconnected to the ventilator. Thorough tracheal and oral suctioning was done, and the patients were extubated. An oxygen flow of 4 L min-1 was administered via the nasal cannula during the procedure to patients in both groups. Immediately after extubation, both groups of patients received oxygen by a Venturi mask with FiO2 of 0.4.
Outcomes
The primary outcome was the change of lung ultrasound scores at the end of SBT, 30 minutes, 6 hours, and 24 hours after extubation compared between the groups. To limit operator bias, the assessor was blinded to the group to which the patients belong, and a single assessor performed the USG at all points in time. The patients were in a propped-up position of 45 degrees during the measurements. The secondary outcomes included assessing the changes in the pre-extubation and post-extubation (within 24 hours) chest X-ray findings and changes in lung ultrasound scores within the groups. The difference in alveolar-arterial oxygen gradient (A-a O2 gradient), the incidence of adverse clinical events, i.e., extubation failure within 48 hours, desaturation, new onset bronchospasm, tachypnoea, tachycardia, hypertension, pneumonia, ICU-free days and reintubation rates in the two groups were also assessed.
Sample size calculation
The independent variances of the outcomes in a previous study by Soummer et al. [8] were used to calculate the sample size of our study using a two-sided test. To detect a difference of a minimum of 2 points in the post-PPE lung ultrasound scores (LUS) between the two groups, 32 patients in each group were needed assuming an alpha error of 5% and a power of 80%. To adjust for a potential drop-out of 10% of patients, the sample size was increased to 35 patients in each group.
Statistical analysis
The trial was analysed by comparing two methods of extubation using an intention-to-treat approach. The primary outcome, the difference in LUS at multiple time points between two groups, was analysed using the Wilcox test with Bonferroni correction, supported by a longitudinal analysis accounting for multiple correlated observations using the Friedman test.
Lung USG scores were expressed as median with IQR. The differences in secondary outcomes were analysed based on distribution using the c2 test, Fisher’s exact test, Student’s t-test or the Mann-Whitney U test. Further, due to the small sample size, the differences in baseline and demographic parameters between groups were also analysed using univariate methods. All statistical analyses were performed using R software (R foundation). Further, to investigate the expected heterogeneity in the trial, subgroup analysis was planned with comparison between the following groups: male vs. female, age > 65 years vs. < 65 years, and medical vs. surgical patients [9–14].
RESULTS
Demographic and clinical characteristics
The baseline characteristics of participants in both groups were comparable (Table 1). The median age (years) in PPE group was 41 (23.5–57.0), and in the TE group, 49 (33–61), with no significant difference between them (Table 1). The distribution of cases based on the broad diagnosis of medical and surgical categories was also comparable between the PPE and TE groups. There were no significant differences in other parameters: blood pressure, heart rate, and respiratory rate at the end of the SBT and post-extubation between the two groups.
TABLE 1
Comparison of demographic, anthropometric and vital parameter details
Primary and secondary outcomes
The primary outcome (change in LUS) was available to all patients in both groups. The median LUS at post-extubation 30 minutes, 6 hours, and 24 hours was significantly lower in the PPE group [5 (4–8) (P = 0.04), 5 (3–8) (P = 0.02), 4 (3–7) (P = 0.02), respectively] compared to the control group [which were 6 (6–8), 6 (5–7.5), 6 (5–7.5) (P = 0.02), respectively] (Table 2). There was a persistent lowering of the scores at the end of 24 hours in the PPE group.
TABLE 2
Comparison of primary and secondary outcomes between the two groups
[i] SBP – systolic blood pressure, IQR – inter quartile range. A-a O2 – alveolar-arterial oxygen gradient, NIV – non-invasive ventilation, HFNC – or high flow nasal cannula; LUS – lung ultrasound score which is calculated across 6 segments in each lung. Points are as follows: 0 – presence of lung sliding, A-profile with less than 2 B-lines; 1 – presence of well-defined B-lines, less than 50% of the lung field; 2 – well-coalesced B-lines with “white lung”; 3 – consolidation or tissue-like pattern; total out of 36 points [26]
No significant difference was seen in the A-a O2 gradient, CXR findings, or ICU-free days at the end of the SBT and post-extubation between the PPE and TE groups. The proportion of patients without adverse clinical events was significantly higher in the PPE group as compared to the TE group (no side effects: 80% vs. 57.14%, P = 0.04). NIV/HFNC requirement post-extubation was seen in 6 and 11 patients, respectively (P = 0.163). The reintubation rates were 2.86% and 11.43% (P = 0.35) (Table 2). There were two deaths in the study, both in the TE group (P = 0.49). These patients were reintubated and succumbed due to multi-organ distress syndrome 9 and 10 days later.
Subgroup analysis
In the male subgroup, we found that the LUS, CXR changes, A-a O2 gradient, ICU-free days and re-intubation rates were similar between the two groups. However, the post-extubation respiratory rate was significantly higher in the TE group when comparing both groups overall [23.89 ± 3.25 vs. 21.14 ± 4.31, P = 0.049)]. In the female subgroup and in the subgroup with age < 65 years, the LUS, CXR changes, A-a O2 gradient, ICU-free days and re-intubation rates were similar between the groups. However, the post-extubation SpO2 was significantly higher in the PPE group [female: 99 (98–99) vs. 97 (97–99), P = 0.019; age < 65 years: 99 (98–99) vs. 97 (96.5–99.0), P = 0.004]. In the subgroup of patients aged ≥ 65 years, the LUS were significantly lower in the PPE group at 30 minutes [4 (4–4) vs. 6.5 (5.75–6.25), P = 0.01], 6 hours [4 (4–4) vs. 6 (5–7), P = 0.01] and 24 hours after extubation [4 (4–4) vs. 5 (5.00–6.25), P = 0.02]. The other parameters were similar between the groups (Table 3).
TABLE 3
Comparison of primary and secondary outcomes of subjects between the 2 groups in the various subgroups
[i] SBT – spontaneous breathing trial, IQR – inter quartile range, A-a O2 – alveolar-arterial oxygen gradient, NIV – non-invasive ventilation; LUS – lung ultrasound score, which is calculated across 6 segments in each lung. Points are as follows: 0 – presence of lung sliding, A-profile with less than 2 B-lines; 1 – presence of well-defined B-lines, less than 50% of the lung field; 2 – well-coalesced B-lines with “white lung”; 3 – consolidation or tissue-like pattern; total out of 36 points
DISCUSSION
The LUS were significantly lower in the PPE group at 30 min [5 (4–8) vs. 6 (6–8), P = 0.04], 6 hours [5 (3–8) vs. 6 (5.0–7.5), P = 0.02] and at 24 hours after extubation [4 (3–7) vs. 6 (5.0–7.5), P = 0.02], indicating better aeration. The reason could be that the traditional extubation technique with endotracheal suctioning causes more leakage alongside the cuff and promotes the aspiration of subglottic secretions into the lower respiratory tract. This leads to micro-atelectasis and possible aspiration pneumonia that worsens parenchymal compliance and can lead to worsening or non-improvement of lung aeration scores.
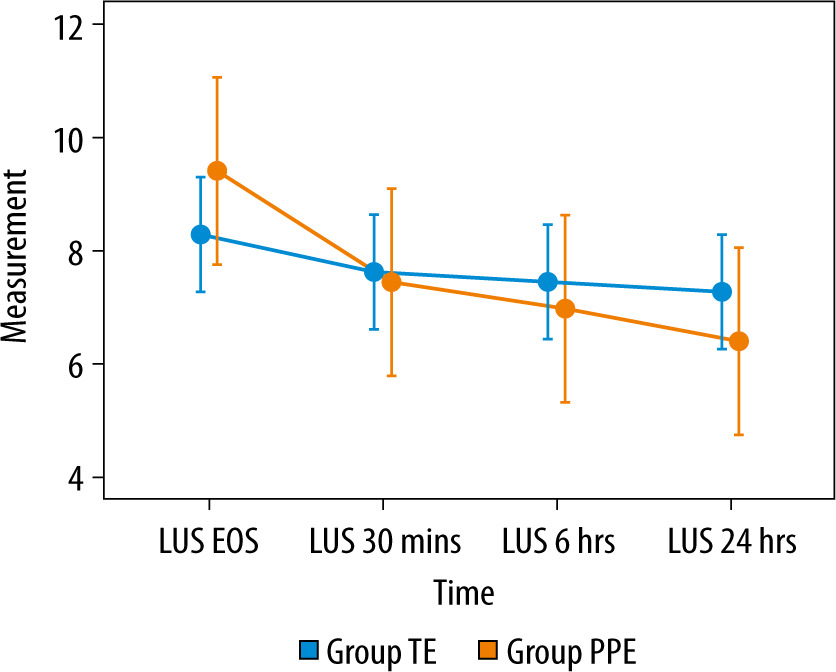
The PPE group was found to have a persistent lowering in the LUS even after 24 hours of follow-up. In the intragroup analysis, we found that the LUS were significantly lesser between the various time points of measurement except between 30 min and 6 hours. This could be due to the positive pressure at the end of the SBT that improves aeration and brings out peri-cuff secretions to the oral cavity, which are then suctioned out, thus reducing the chances of aspiration. Additionally, the use of post-extubation NIV or HFNC in a few patients could have had an impact on the LUS. A similar improvement in lung USG scores was seen in the TE group as well but was not persistent (Figure 2).
These findings are in concordance with a study performed by Soummer et al. [8], which showed that higher lung ultrasound scores were associated with post-extubation distress, and Yadav et al. [15], in which better lung aeration scores predicted successful extubation, with a high level of accuracy.
There was no significant difference between the groups regarding new changes in the CXR (8.5% PPE vs. 22.8% TE, P = 0.10). Lung ultrasound had significantly higher sensitivity for identifying interstitial pneumonia patterns, while CXR takes time to detect changes, as shown in the study by Redondo et al. [16]. This could explain the finding of our study.
We measured the A-a O2 gradient in both groups at two time points, one at the end of the SBT and one an hour after extubation. It was found that the gradient was higher in the TE group (end of SBT 95.63 ± 45.6 vs. PE 118.27± 48.45, P = 0.08), but the difference was not significant. We noted that the persistent lung aeration improvement in the PPE group was not reflected in the A-a O2 gradient. This could be due to external oxygen supplementation within the first half hour after extubation in certain patients [17–21]. This could have led to an insignificant difference in the variation in A-a O2 gradient between the two groups as the measurement of the A-a O2 gradient was done when the patients were on supplemental oxygen for an initial half hour after extubation, despite the constant FiO2. The post-extubation A-a O2 gradient decrease was significant compared to the gradient at the end of the SBT within the groups.
Neither group had a significant difference in the ICU-free days or the reintubation rates. This is due to the fact that the majority of patients who had extubation failure were successfully managed with either HFNC or NIV. A possible reduction in re-intubation rates with the intervention probably would need a bigger sample size. The ICU-free days depended on several other factors and reasons for ICU admission, such as hemodynamic instability, monitoring, postoperative observation, etc., that are independent of the need for mechanical ventilation.
Complications were seen in 22 of our subjects (31.4%), which included extubation failure requiring HFNC or NIV [6 in the PPE group (17.1%) vs. 11 in the TE group (31.4%)], pneumonia defined by a CPIS score ≥ 6, stridor or upper airway obstruction, desaturation, re-intubation and death. There was a statistically significant difference in the incidence of adverse clinical events between the two groups (20% vs. 42% in the normal extubation group, P < 0.05). This is similar to Andreu et al.’s findings in an RCT [1]. The incidence rate for major complications was lower and statistically significant (P < 0.001) in the non-inferiority and superiority analysis, showing that positive pressure was associated with a lower incidence of major complications. However, in the Extubar trial [22], the incidence of complications between the two groups was not statistically significant. We need to consider the probable heterogeneity in the sample size in our study compared to the Extubar trial. Moreover, the comorbid conditions of the individual patients may have contributed to adverse clinical events [9, 23, 24].
Strengths of the study
Our study is novel because there have been no previous studies in relation to using lung ultrasound scores as an outcome assessment method for the loss of aeration and the extubation technique used in the ICU [25]. It identifies zones of atelectasis and consolidation with much better sensitivity as a dynamic assessment tool of the lung [26, 27]. Radiological features of atelectasis, pneumonia or post-extubation pulmonary oedema take considerable time to manifest on the chest X-ray while shifting patients to get a CT chest is also not always feasible in most setups. Moreover, randomisation and double blinding make the study results more reliable and significant.
Limitations of the study
Since ours was a single centre study with a small sample size, the findings must be validated in a larger sample before they can be adopted for routine clinical practice. Despite the healthy mix of cases from medical and surgical diagnoses, the utility of the intervention in other cohorts needs further evaluation. Though the requirement of post-extubation HFNC or NIV support was subjective, dependent on the ICU physician, bias in the outcome assessment was limited by blinding the assessors to the methods of extubation. We did not use higher resolution imaging, such as a CT scan of the thorax, to check the lung aeration of the patients in the study as it was not feasible to shift the patients to a CT scan in our setup on a frequent basis. Future studies may incorporate this assessment as well. There were significant variations in the results of the three subgroups when compared to the overall results. However, these were analyses with a low number of subjects, and the results of the individual subgroup populations should be interpreted as exploratory only. Since our patient group comprised mainly relatively young patients and patients with near normal BMI, the inherent risk of aspiration pneumonia was inherently low, which could have influenced the results. However, the percentages of such patients in both groups were similar. Additionally, not evaluating cough strength and the presence of increased secretions in patients before extubation constitutes a potential limitation.
CONCLUSIONS
The positive pressure extubation method was found to be associated with persistently better lung aeration and fewer complications compared to the traditional extubation in the 24-hour post-extubation period. Though our study is based on a small patient pool and conducted in a single centre, the results have the potential to be validated in larger studies, thereby developing a protocol of extubation that can be applied to the critically ill population with better efficacy and safety.